We all know worldwide vehicle usage has a huge impact on greenhouse gas emissions.
But how much carbon do the vehicles many of us rely on everyday produce?
We conducted a study to find out.
What is the carbon content of my vehicle?
You’ll have seen electric vehicles have no exhaust pipes. This is because they are powered 100% by electricity and do not need to burn any fuel to run the vehicle.
As burning fossil-fuels produce greenhouse gas emissions, electric transport is great for our island – but should we be concerned with how much more carbon electric vehicles generate when they’re produced?
Does an electric vehicle produce more carbon than the same petrol or diesel vehicle when you also take into account the battery production? The short answer here is no.
A recent study revealed the greenhouse gas emissions released from each kilometre driven, and across the complete lifecycle of an average vehicle – including production, maintenance, and exhaust emissions.
An electric vehicle may produce up to 65% fewer carbon emissions over its entire lifecycle than the equivalent petrol vehicle.
1 January to 31 December 2021.
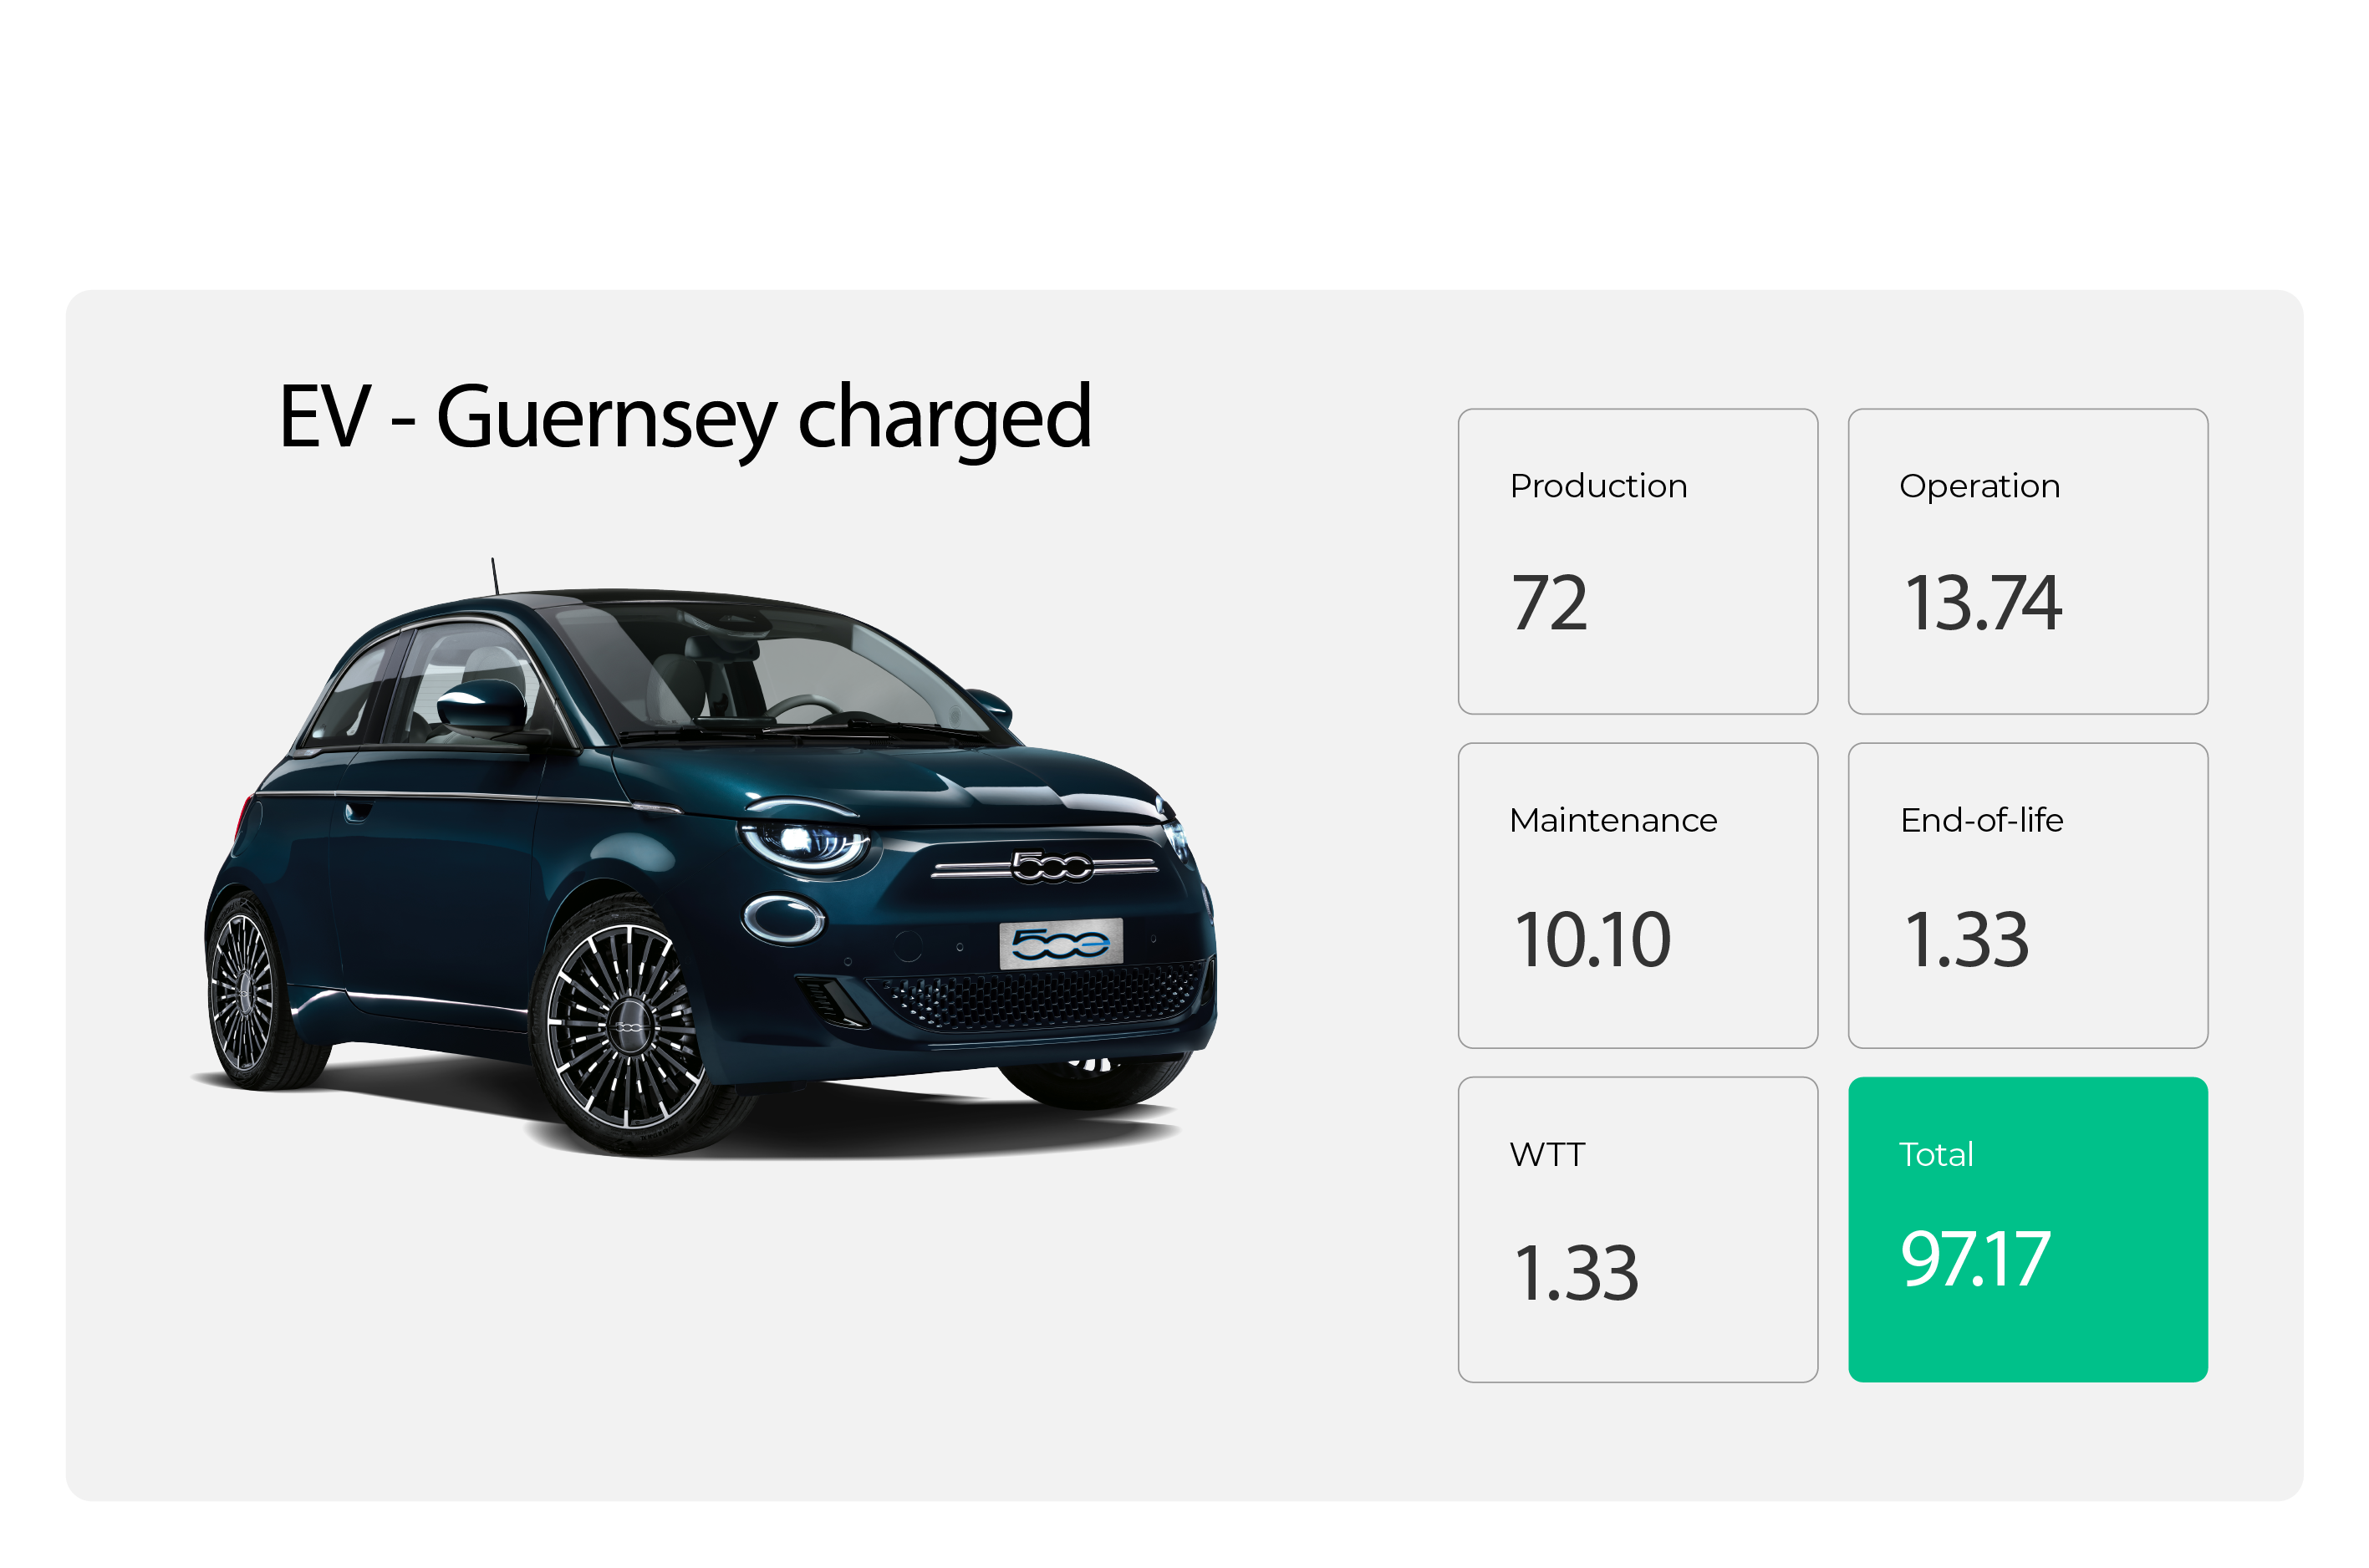
These figures represent the amount of carbon produced per kilometere driven. An EV will produce 97g CO²/km if charged during the day.
1 mile = 1.6 kilometres
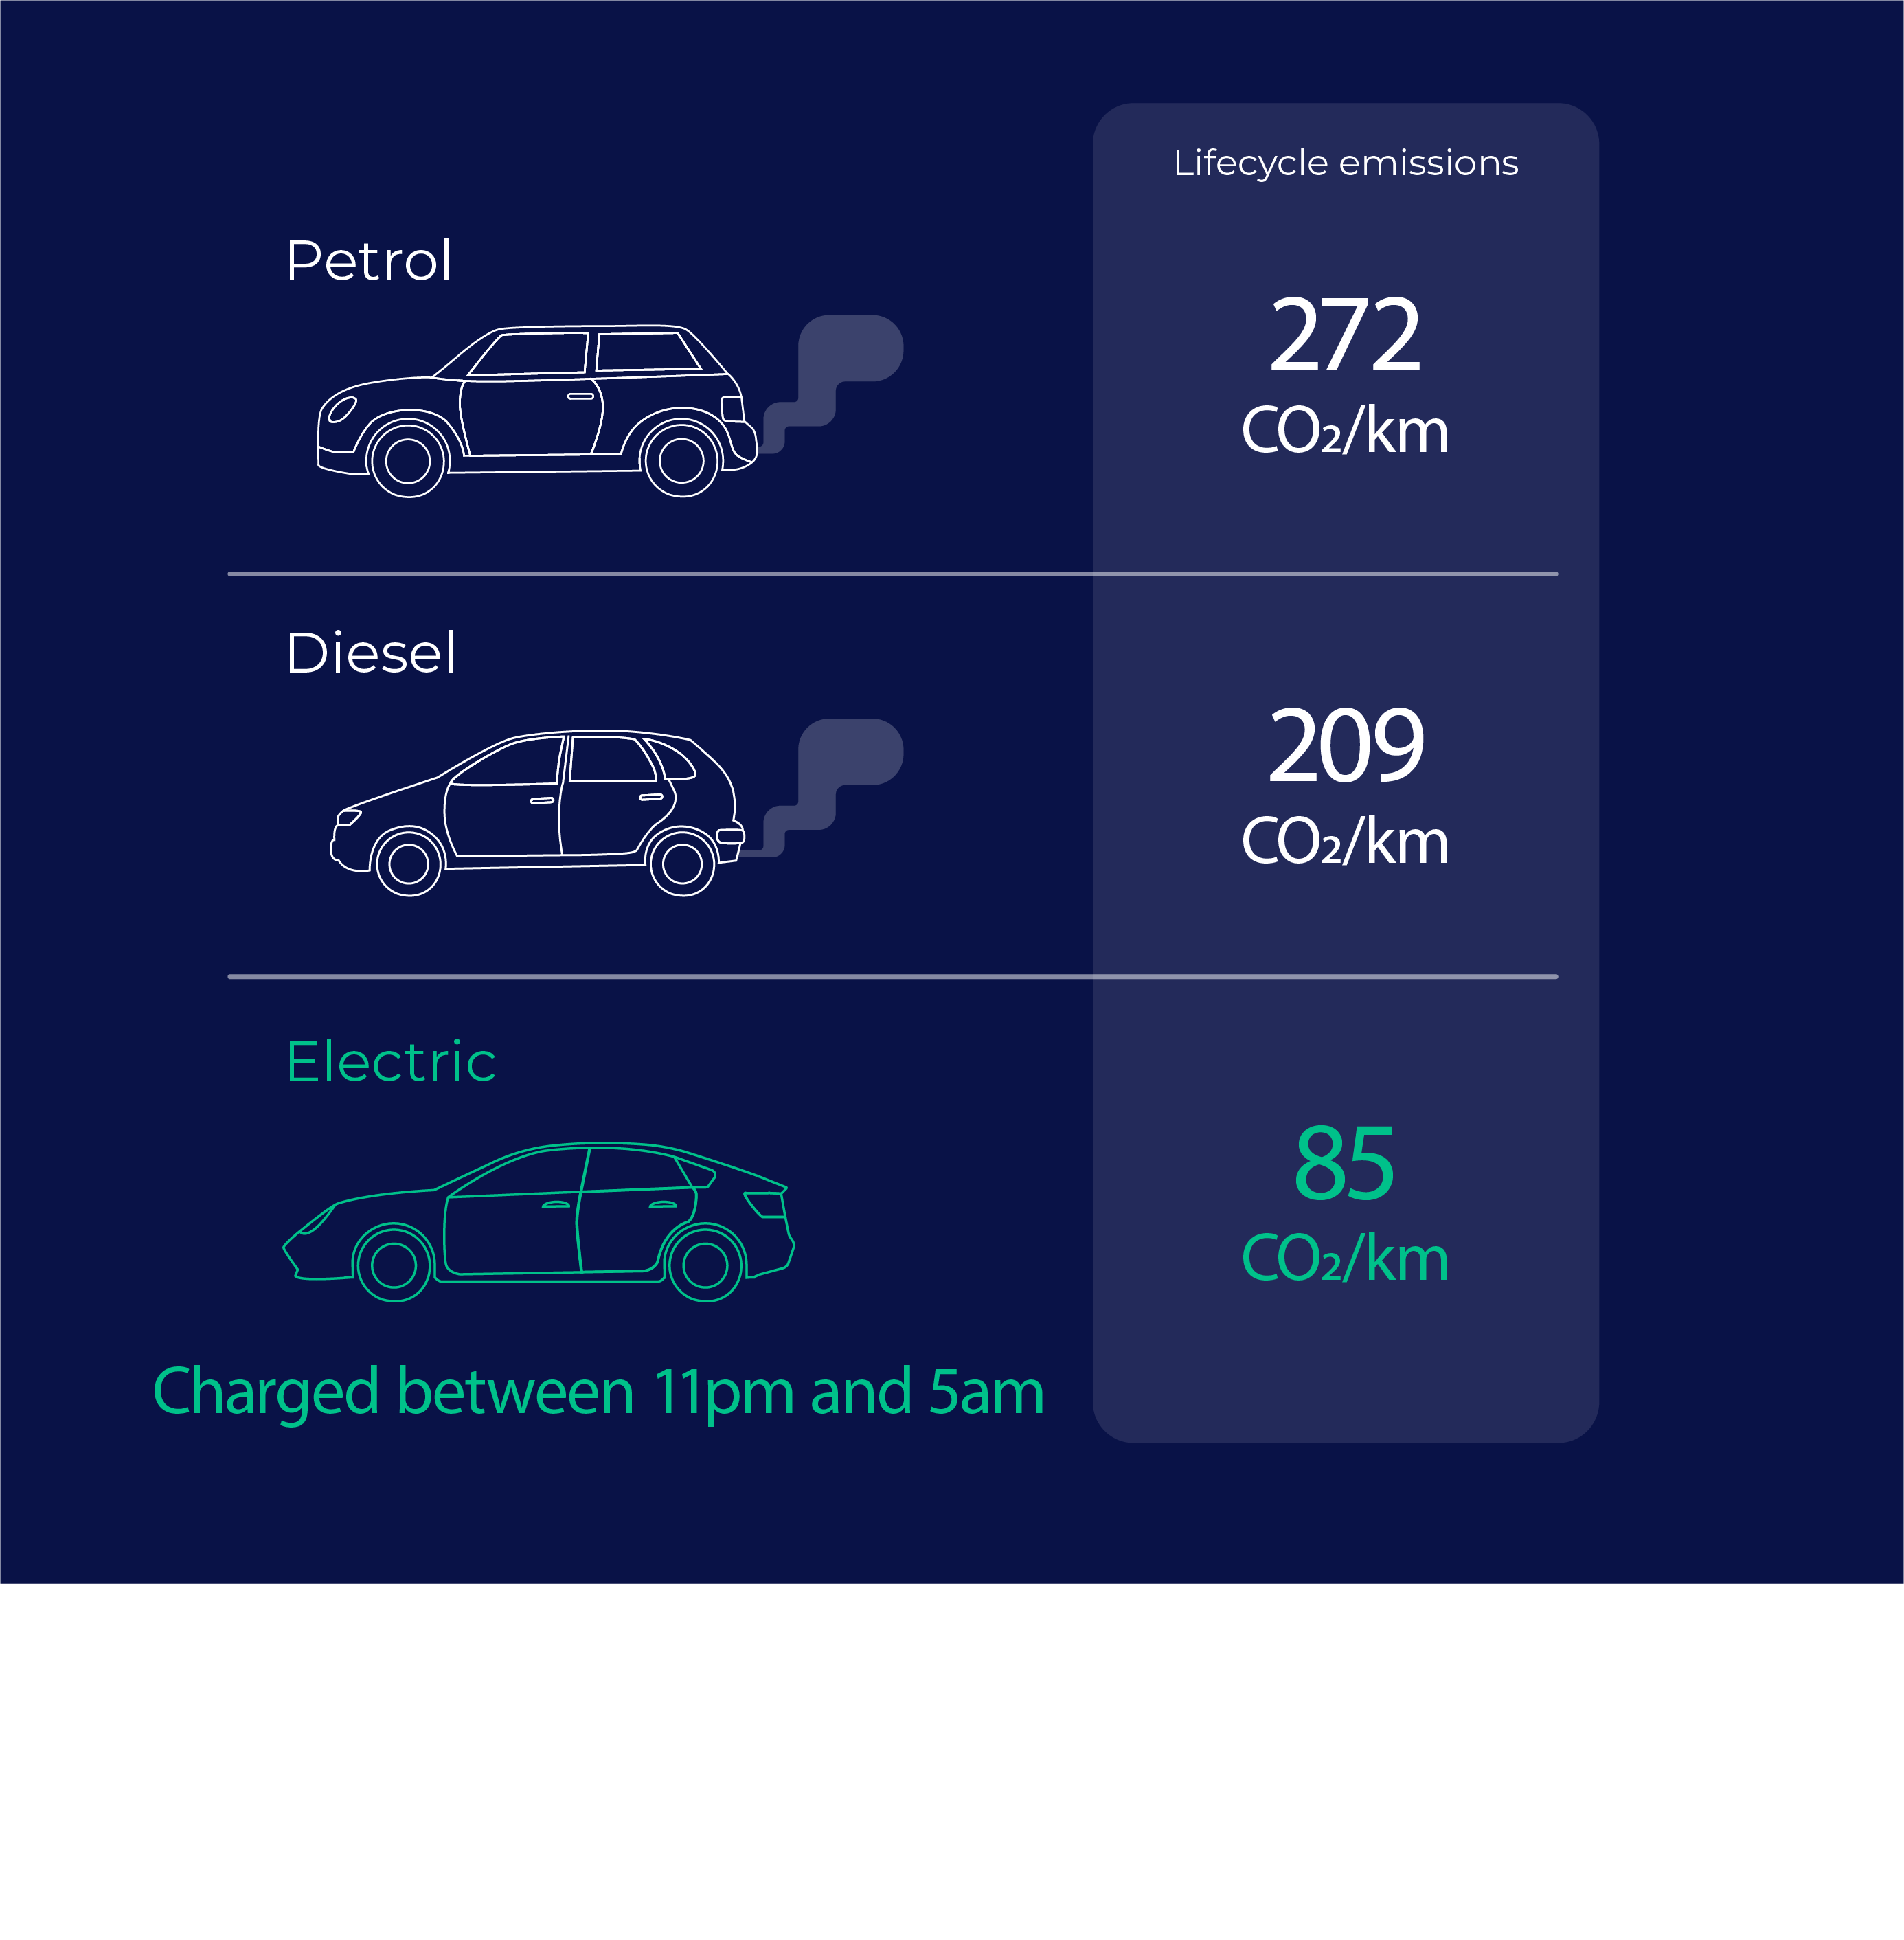
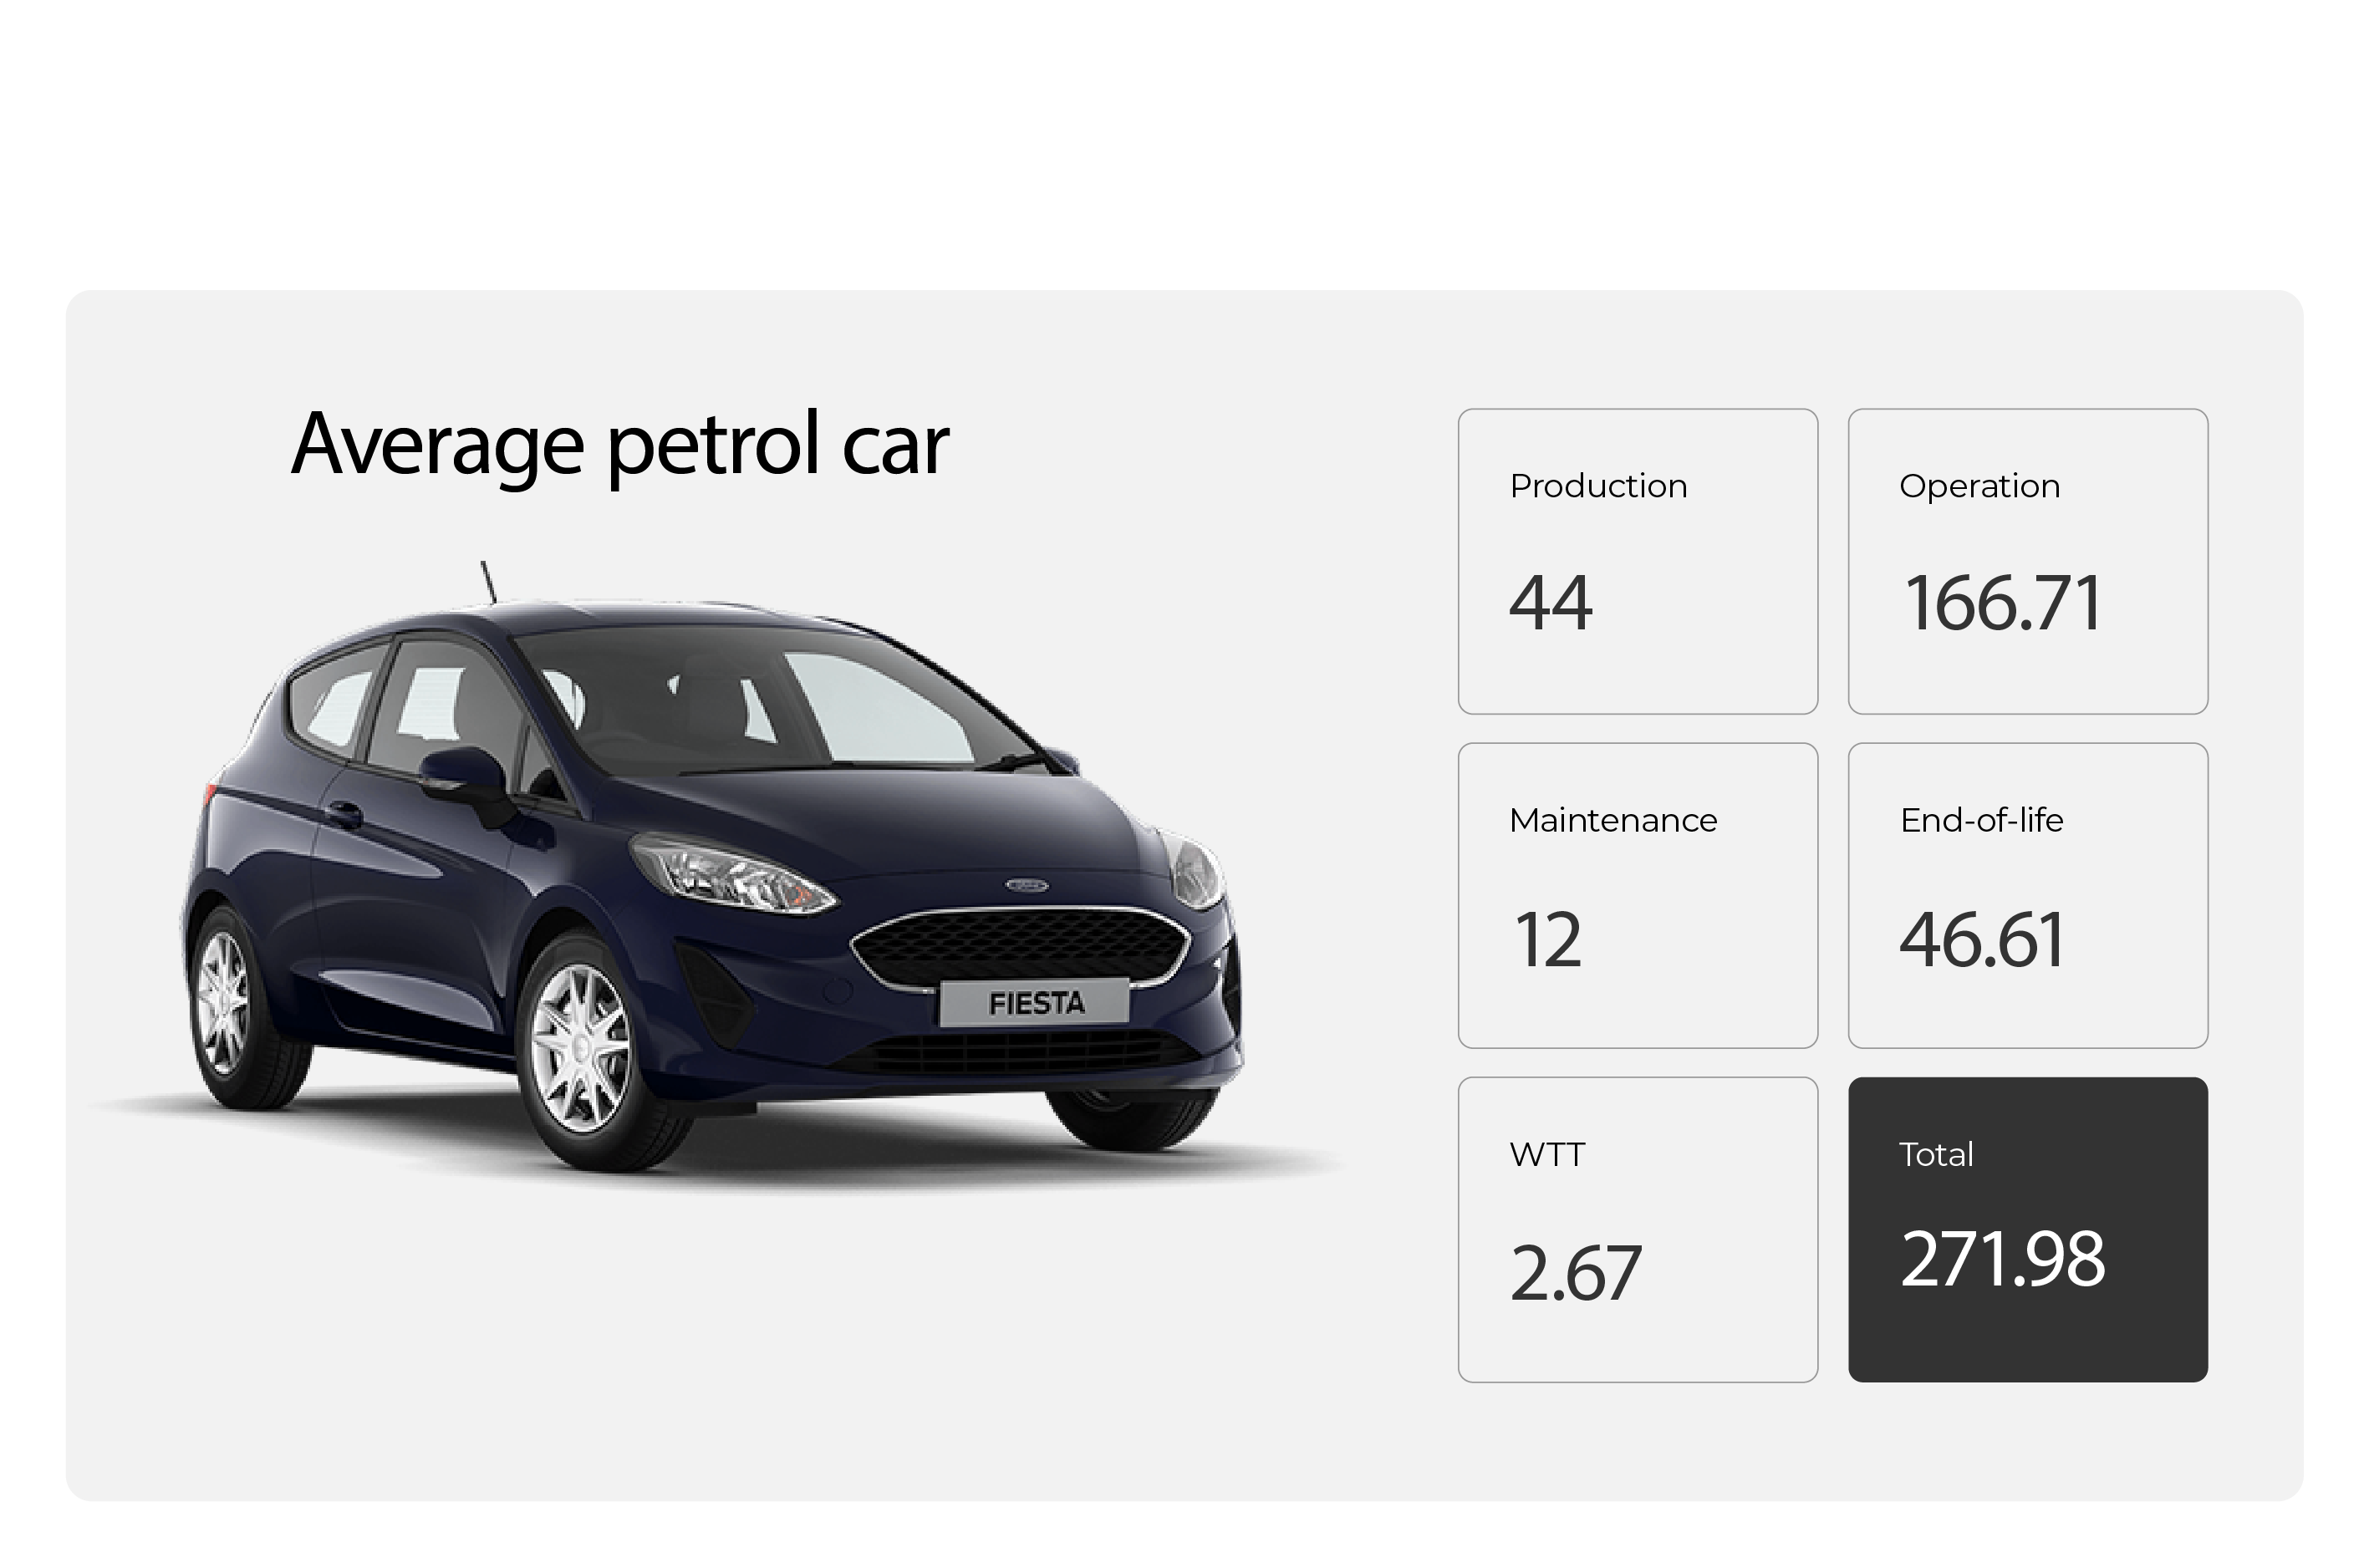
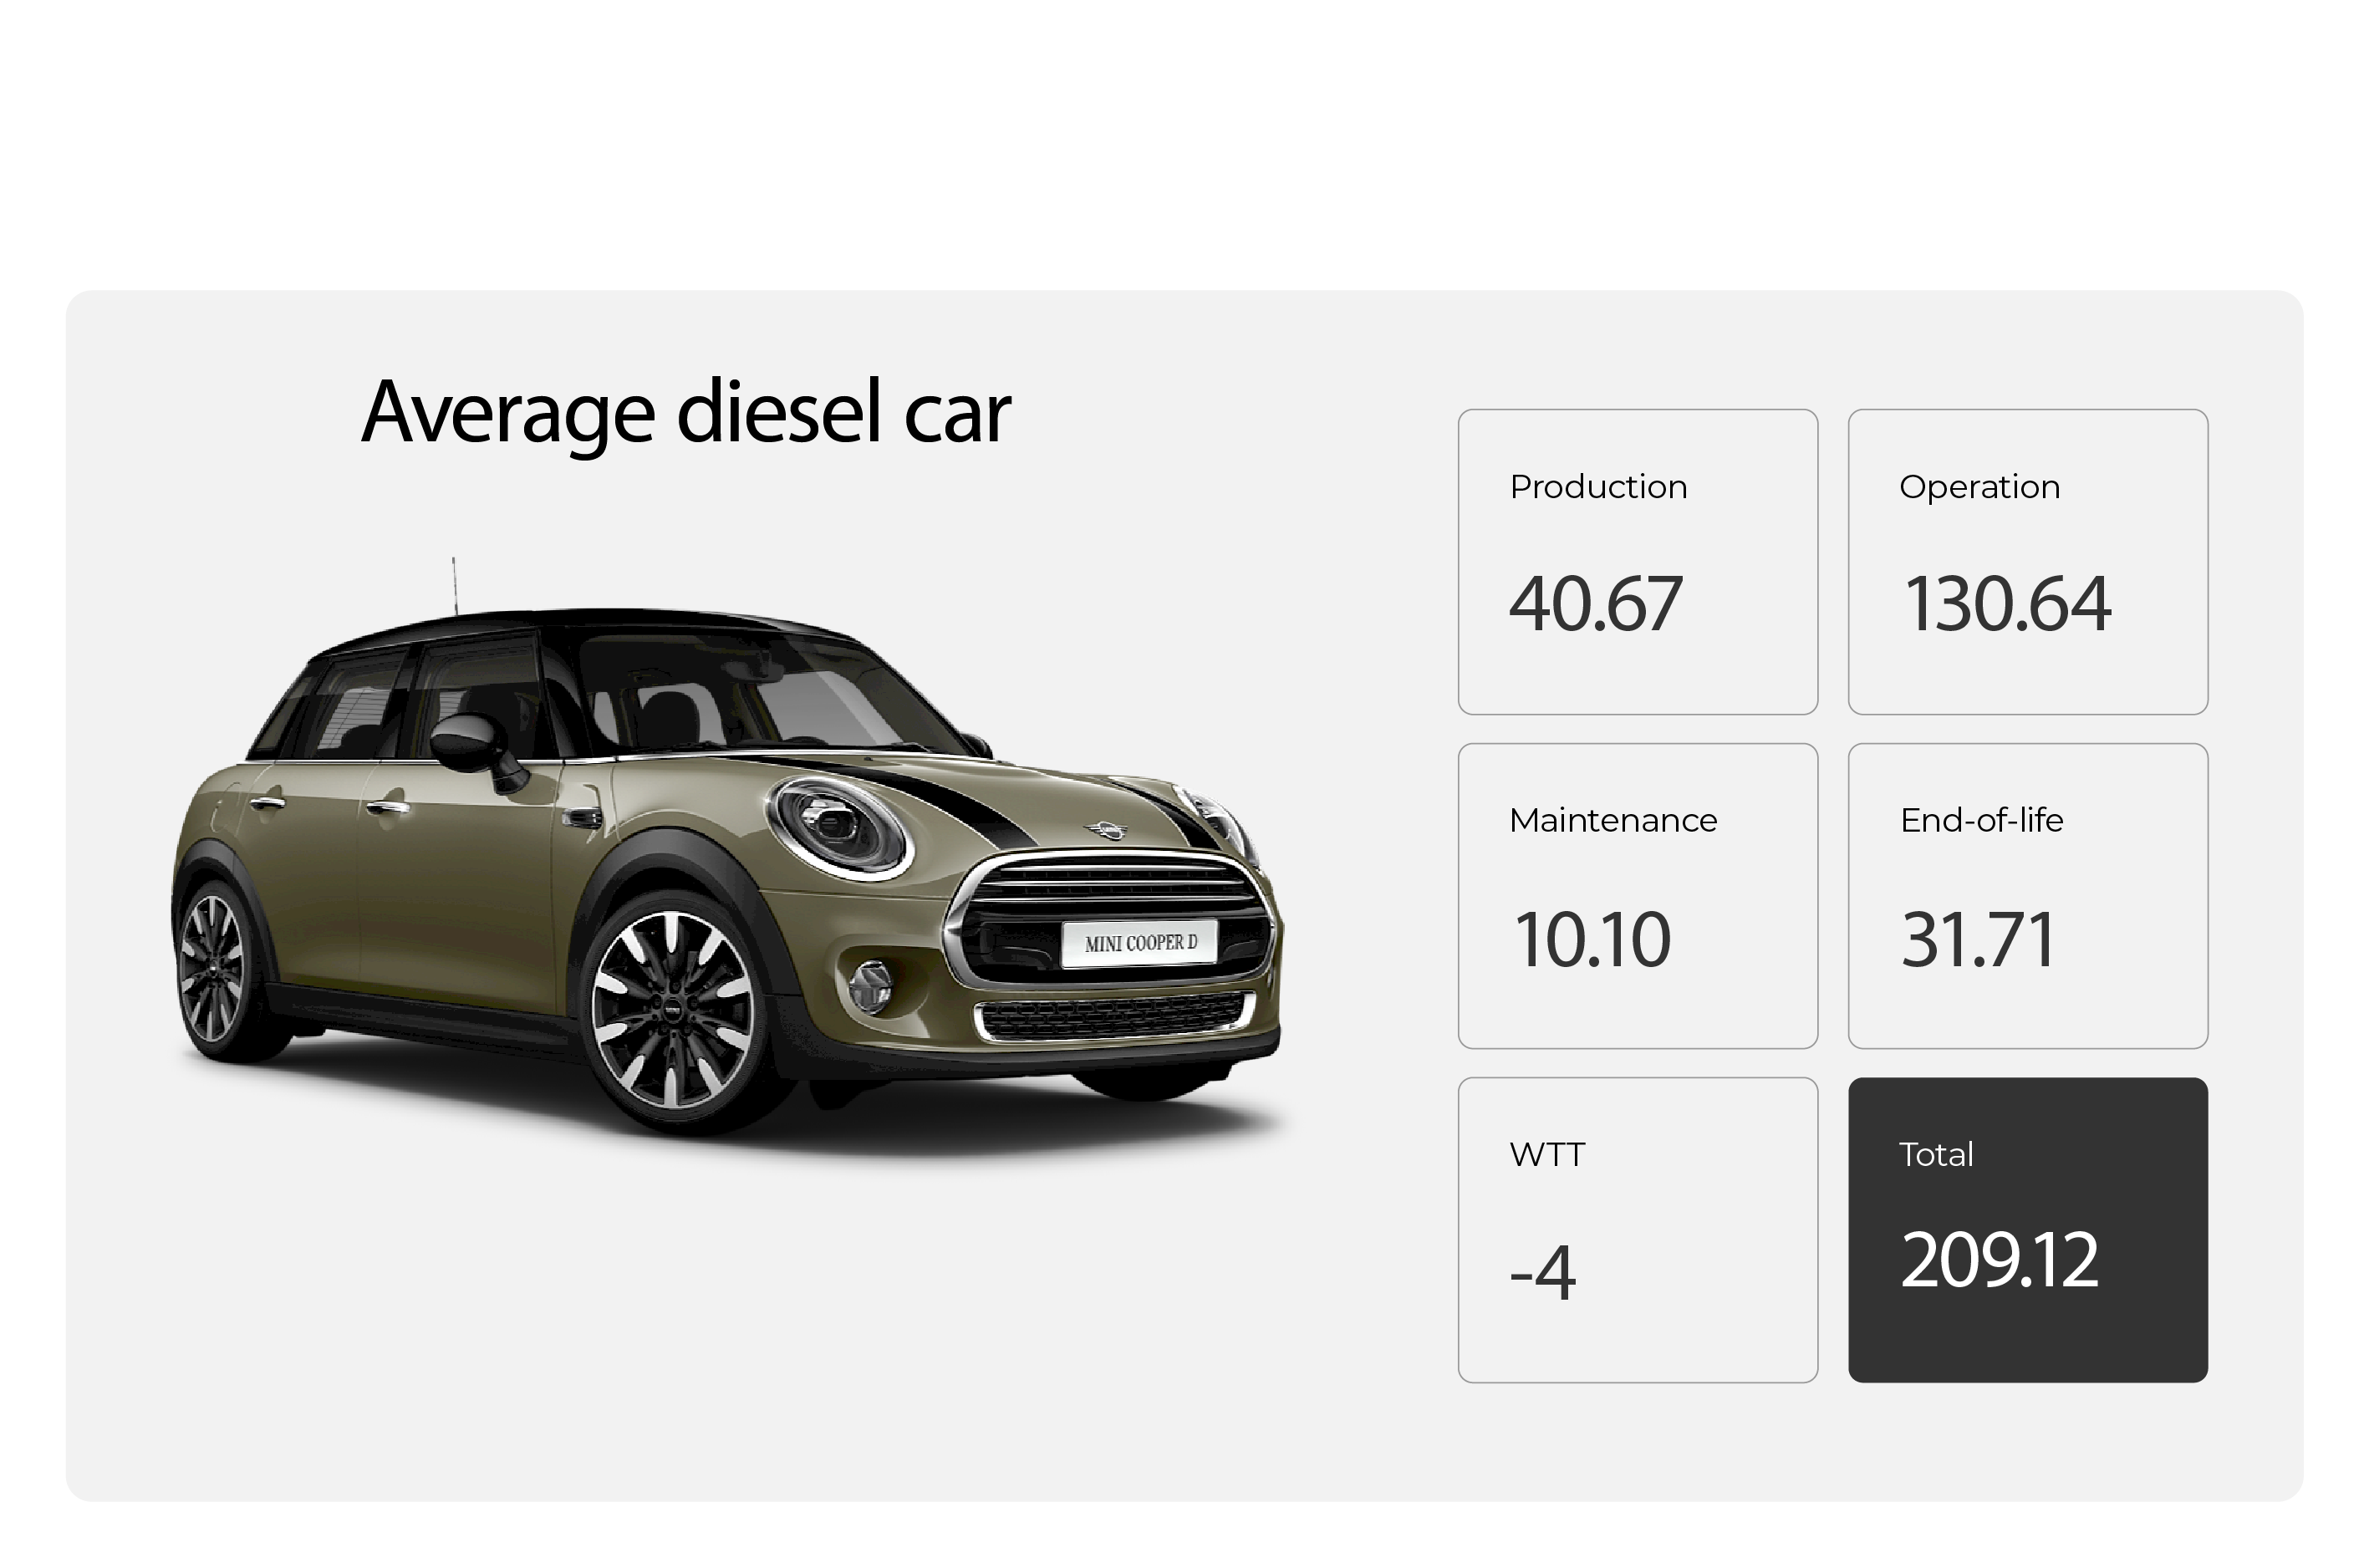
How do EVs compare with everyday petrol and diesel cars?
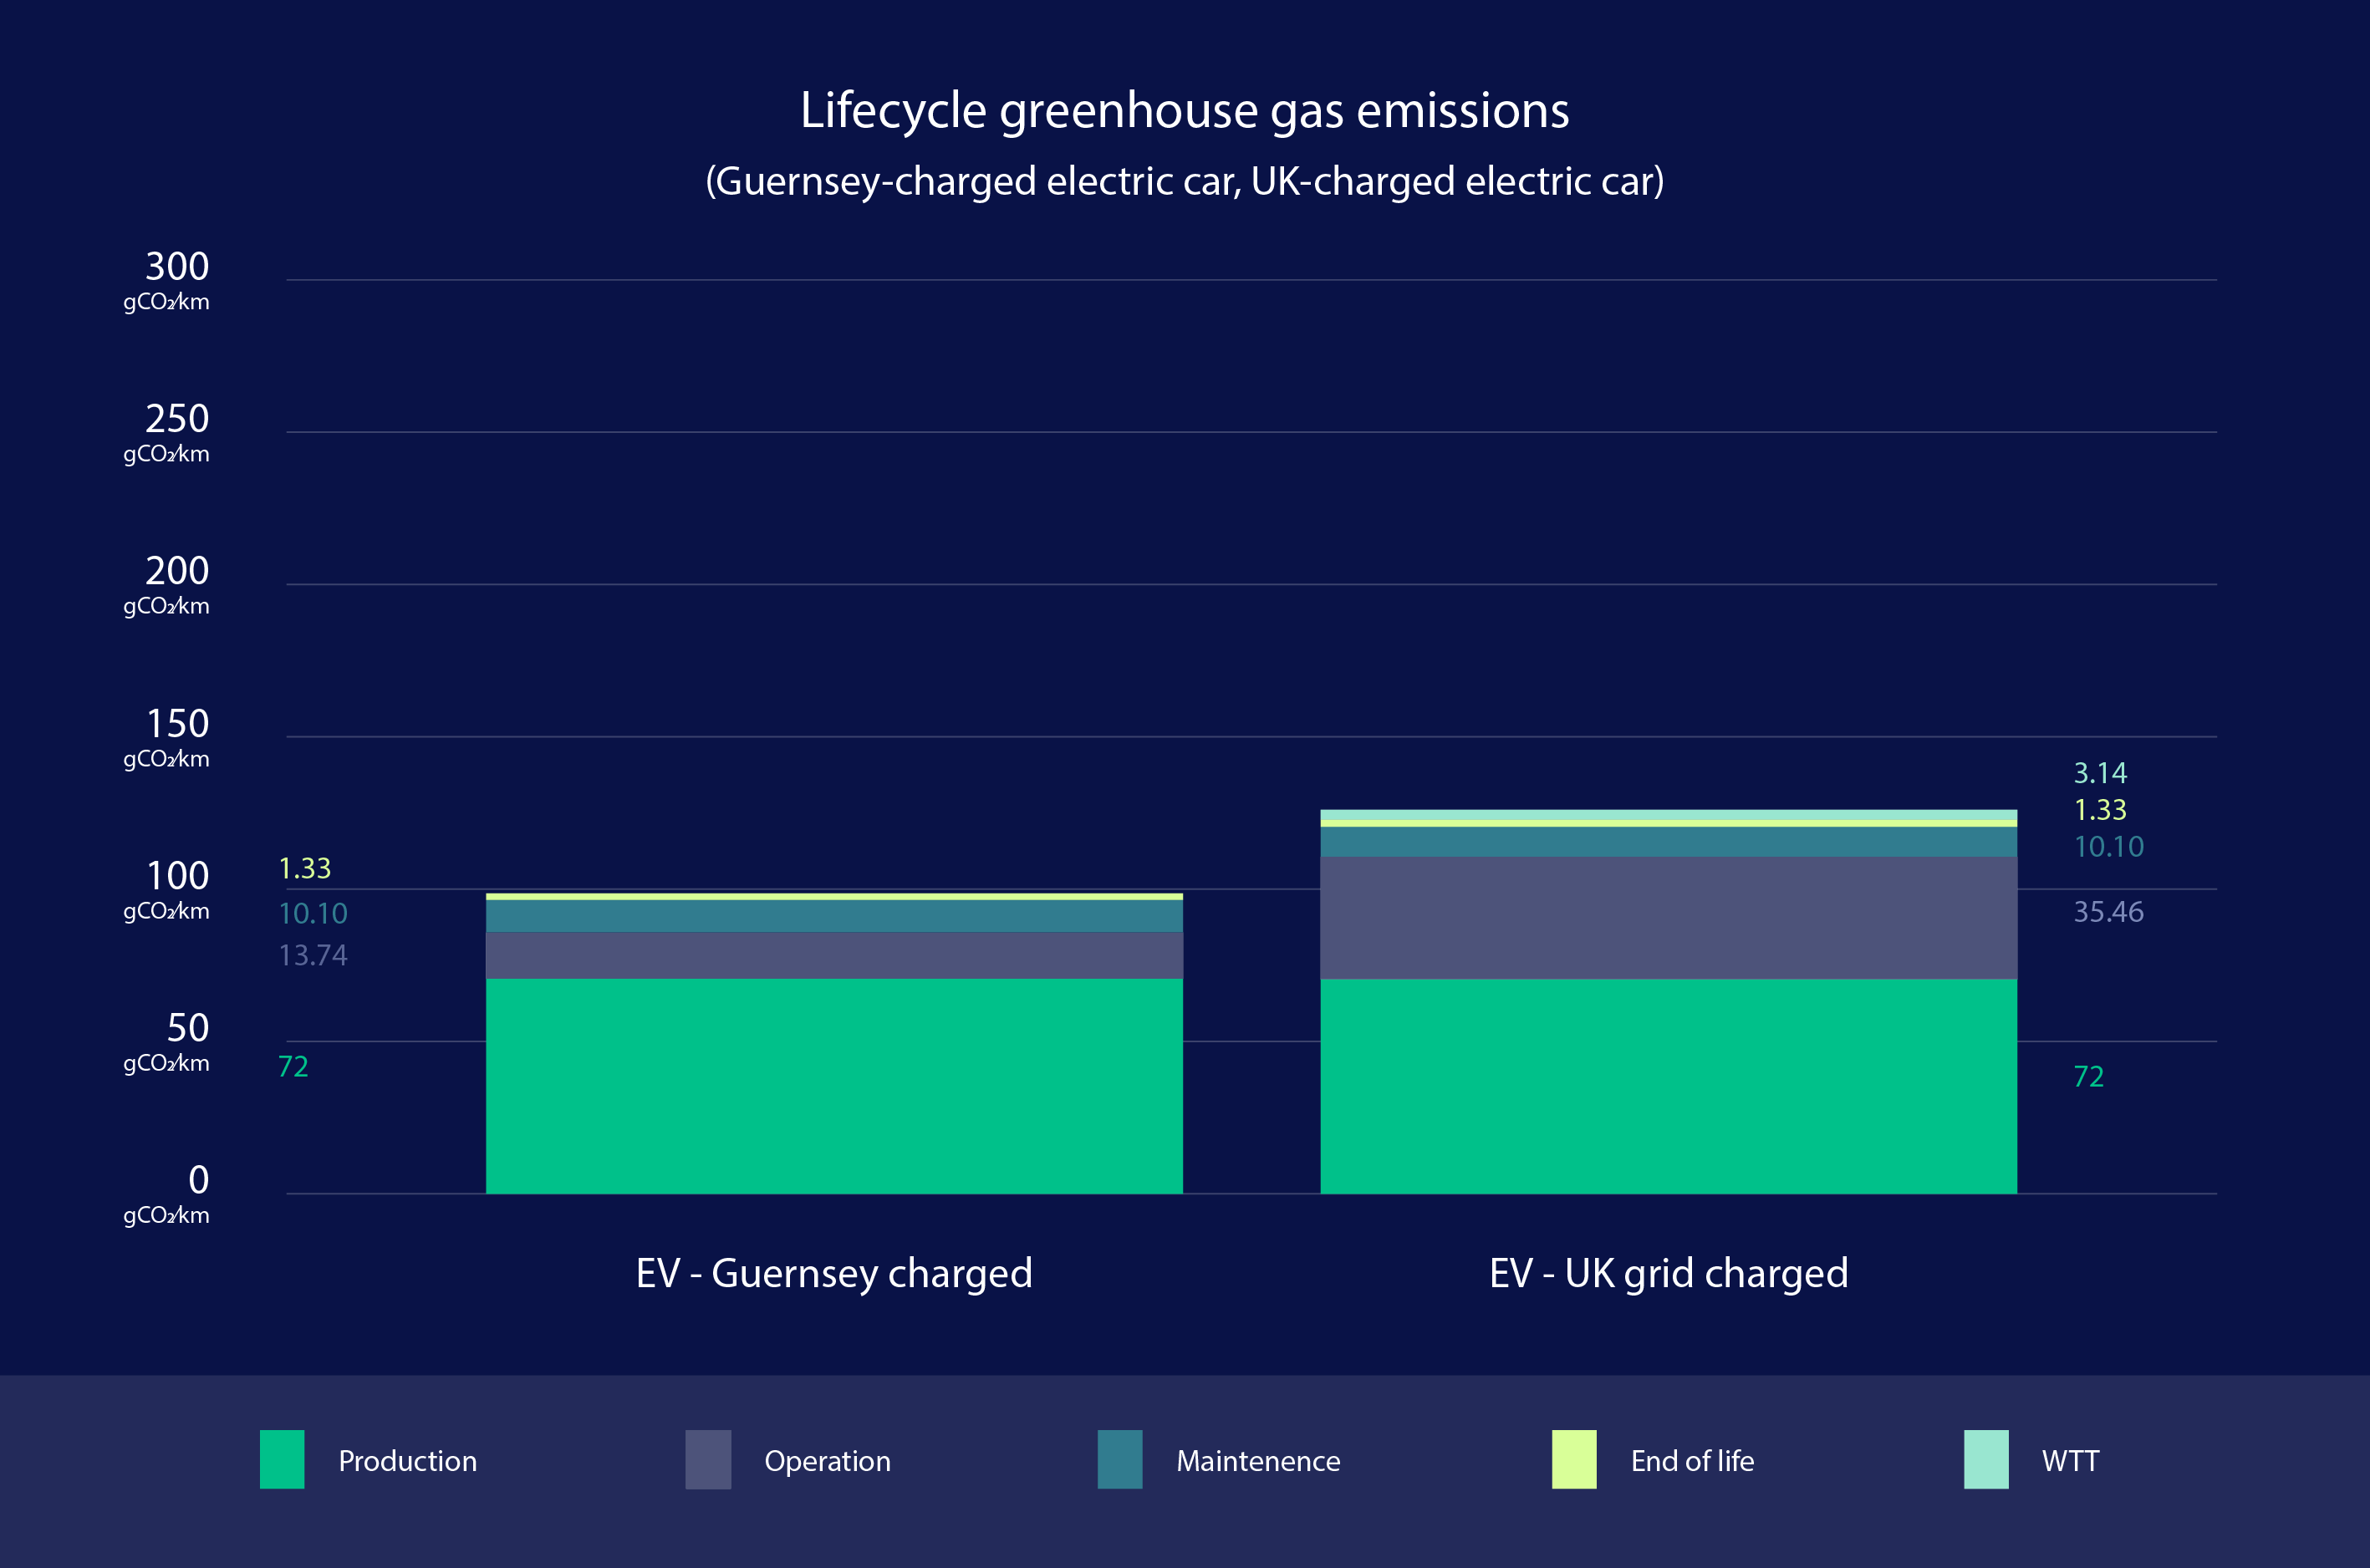
The following figures display the lifecycle greenhouse gas emissions in grams of CO2 per kilometre driven.
Data as of 31 December 2021

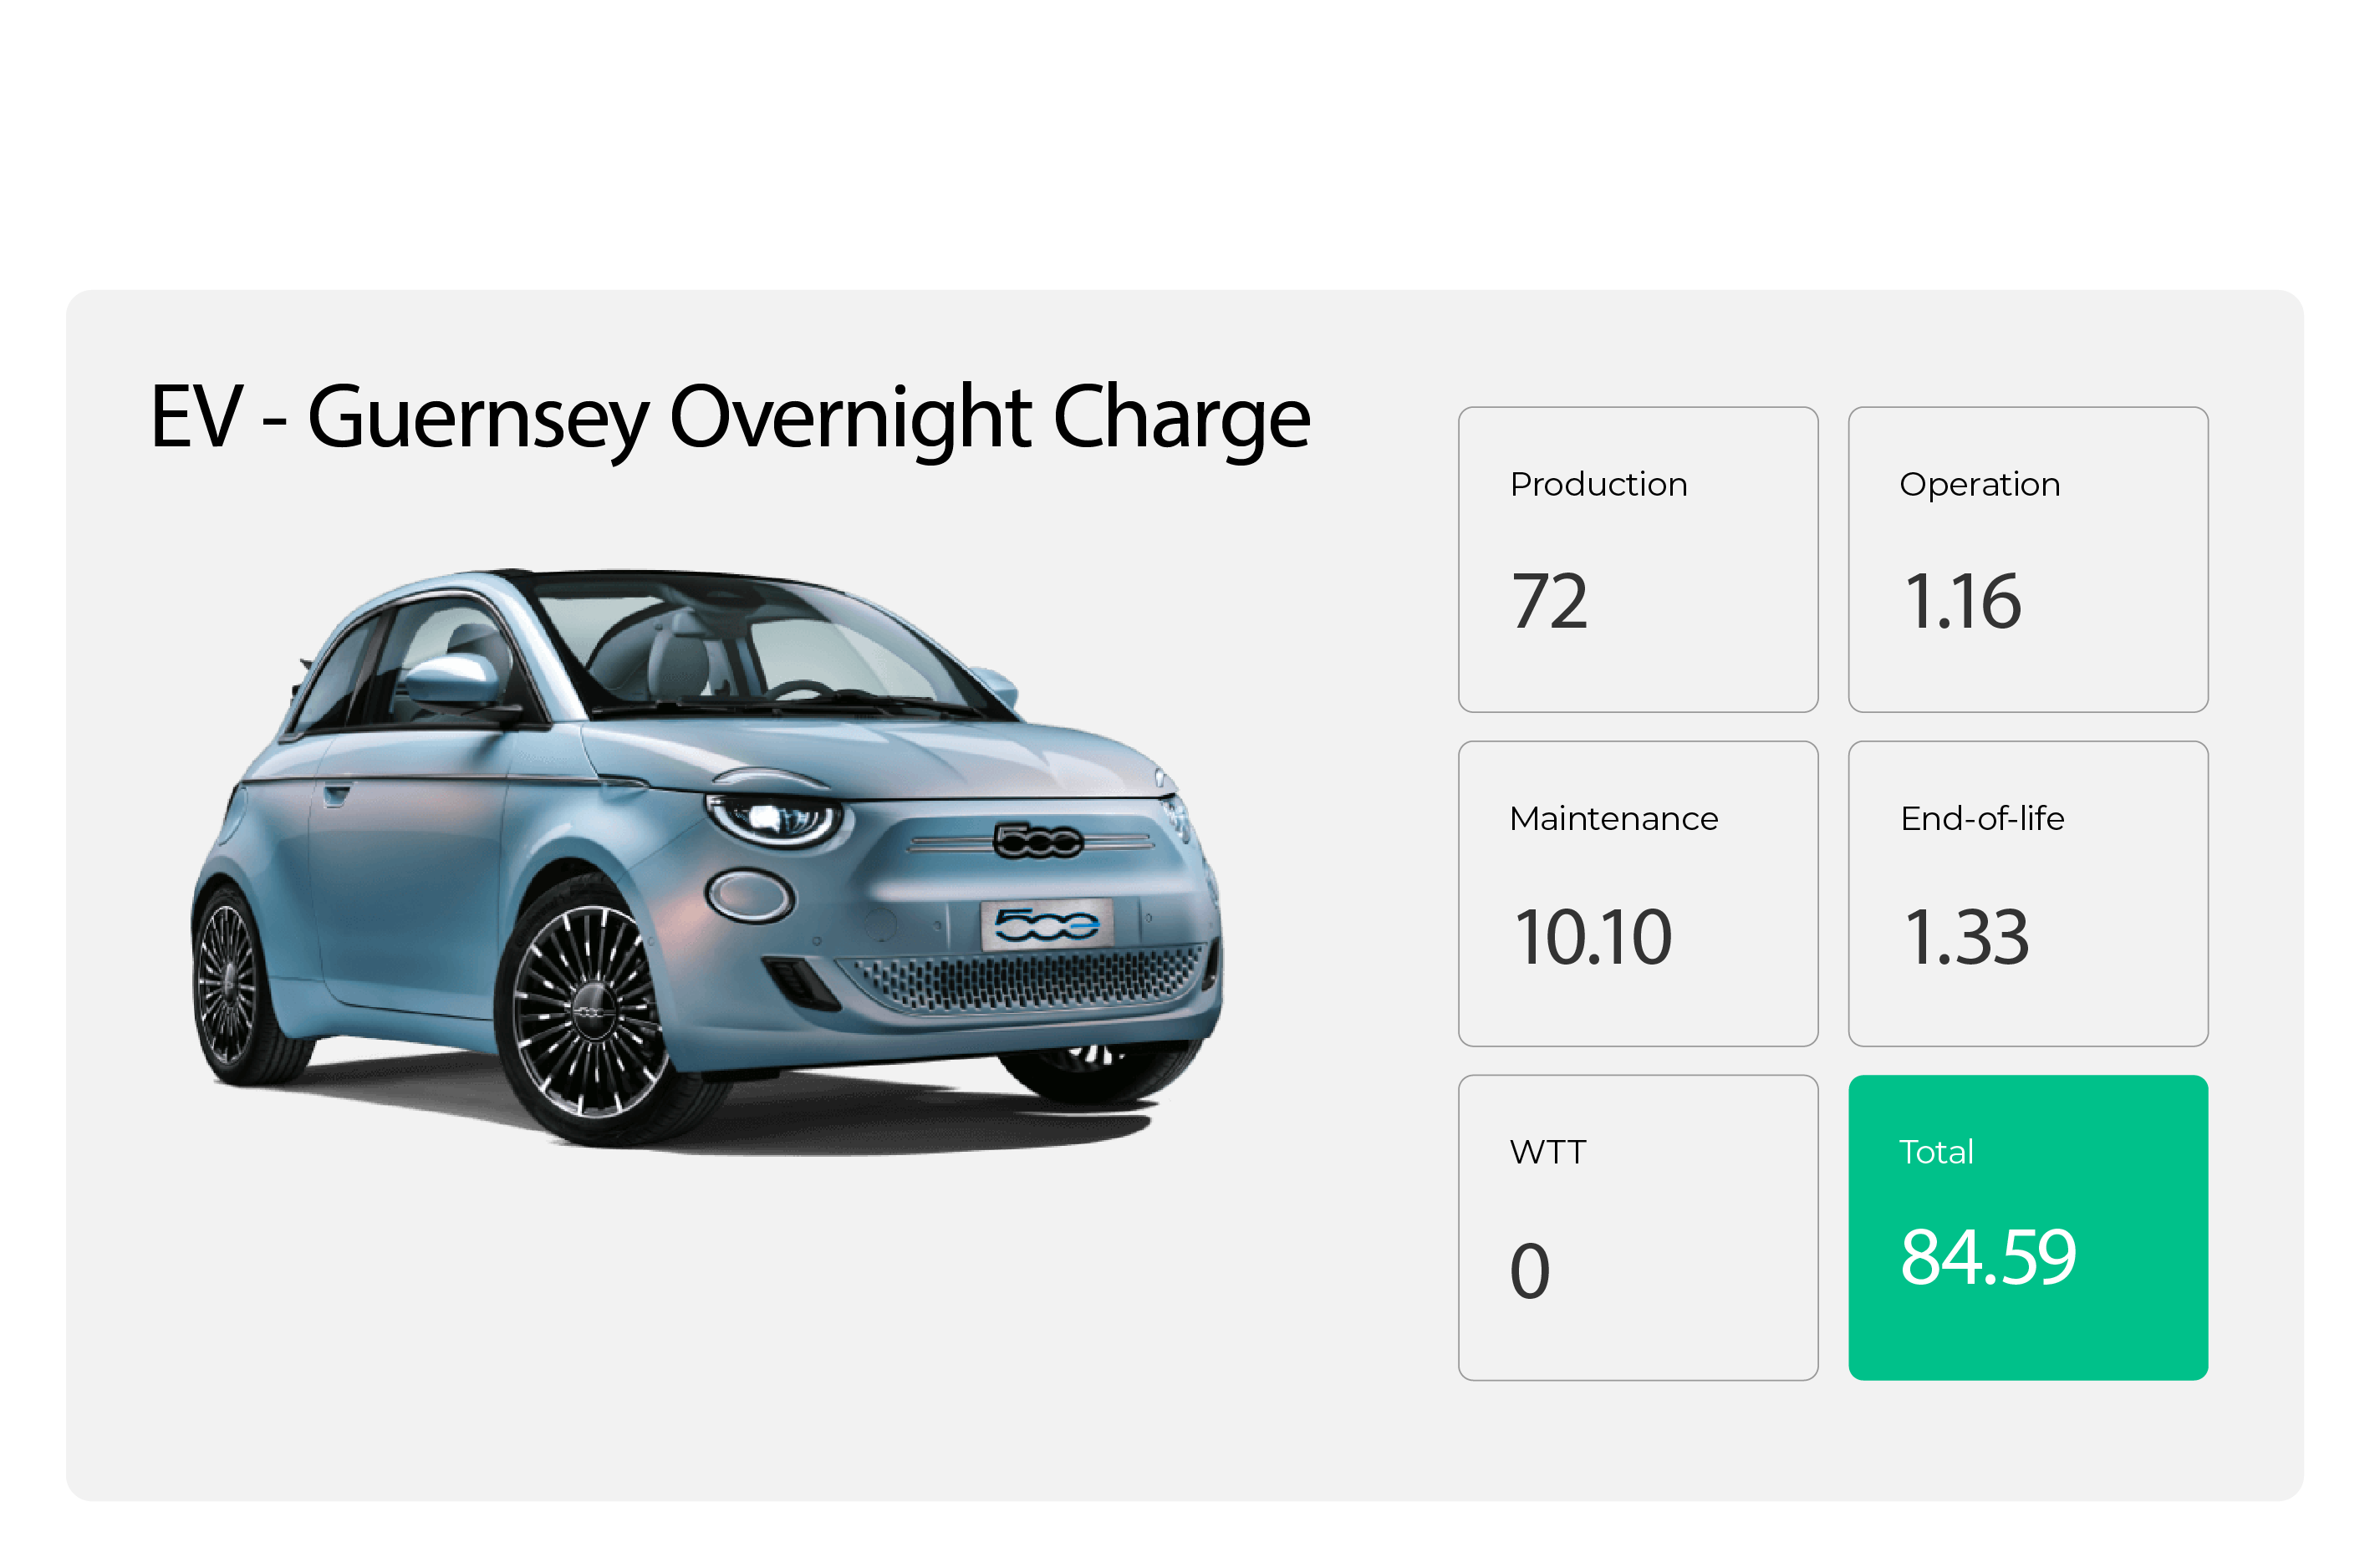
WTT, production, operation - what do these words mean?
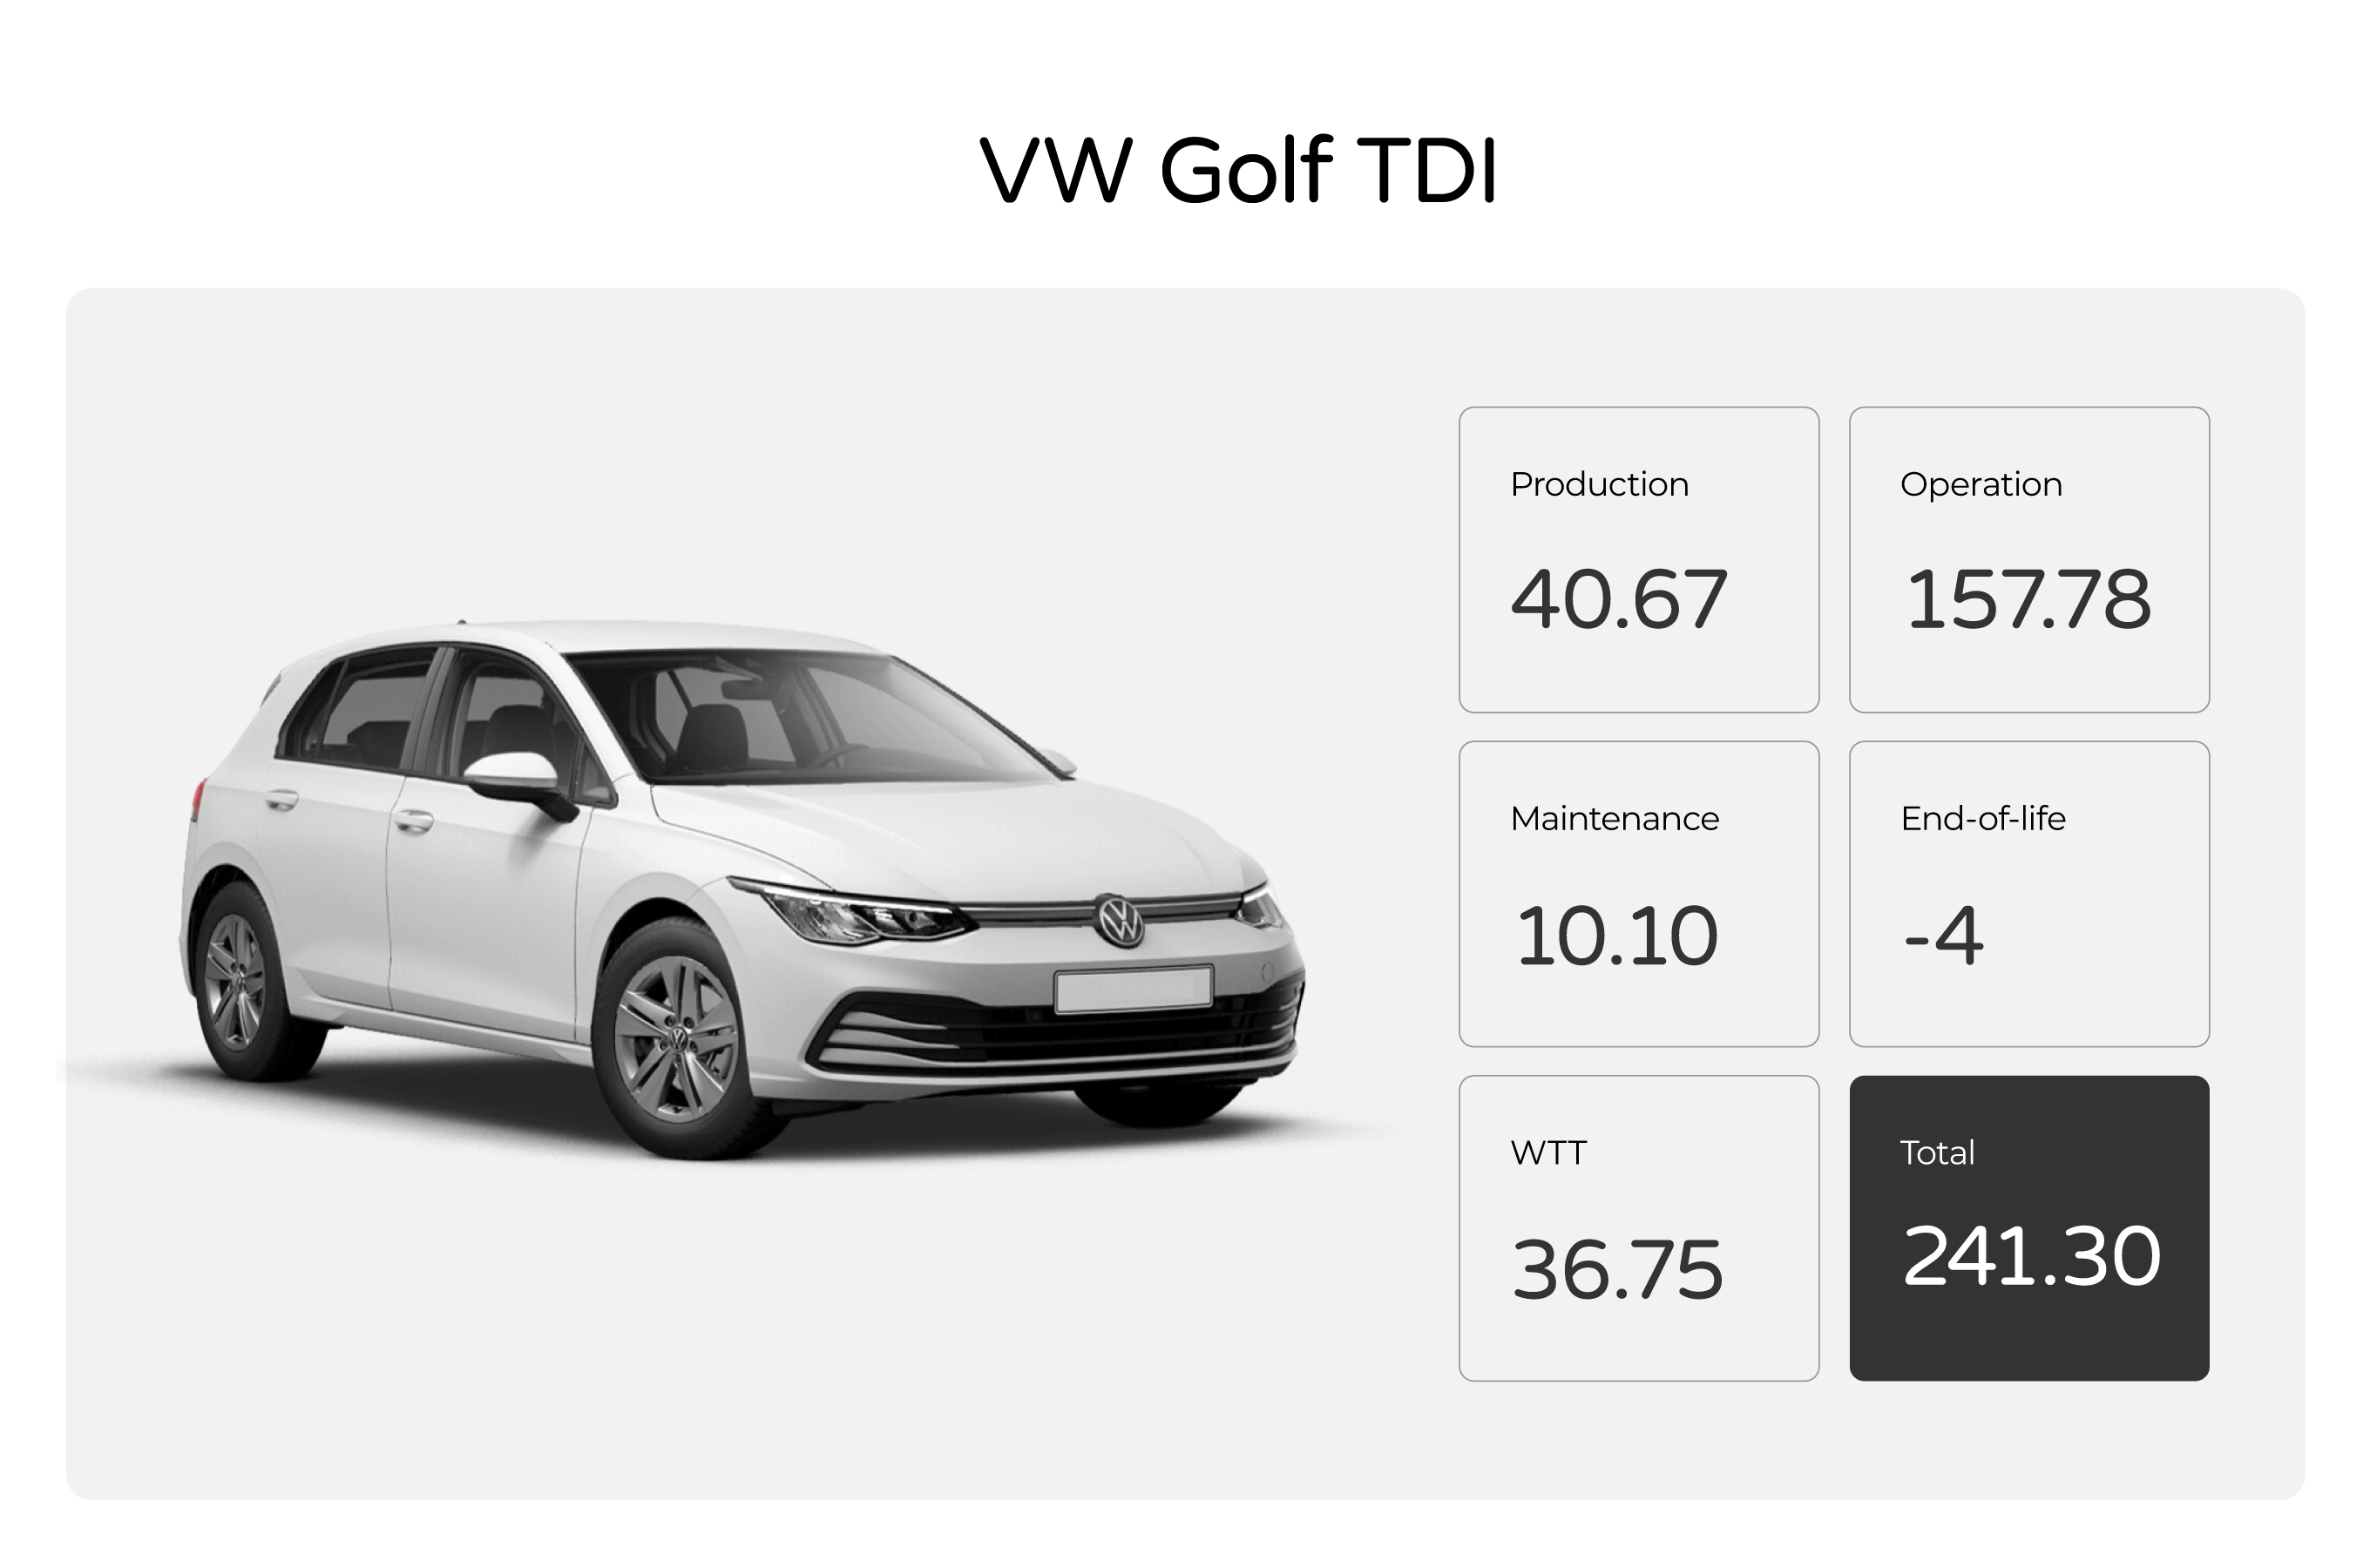
Production
These emissions are generated during the production of the vehicle and include raw material extraction and processing.
Operation
This includes tailpipe emissions from the combustion of petrol/diesel, emissions produced from generating electricity*, vehicle maintenance and well-to-tank (WTT) emissions.
In an electric vehicle, this can be reduced by setting the on-board charge timer to charge between 11pm and 5am.
*this includes electricity generated at the Vale power station. Electricity in Guernsey is made up of over 90% imported renewable energy – a mix of solar, wind and hydro power – with the remaining demand topped up by electricity from the power station.
Maintenance
The carbons emissions generated from maintenance work to keep the vehicle in good working order.
End-of-life
This is when the vehicle, its part and components become waste and needs to be dismantled and disposed of.
Well-to-tank (WTT)
WTT specifically refers to the fuel used in the vehicle, from extraction (well) to final use in the petrol or diesel vehicle (tank).
Our study used data taken from a scientific publication which reviewed and consolidated the results from many Lifecycle Assessments on different vehicle types.

What about the batteries?
Battery recycling is included in the End-of-Life (EOL) figures in this study
The values we have referenced are an average of several studies which included battery recycling.
It’s likely that the impact of these EOL emissions will significantly decrease in the coming years as the battery reclaim process develops and a stable supply of used batteries increases. This means the overall emissions across an electric vehicle’s lifecycle will reduce even further.
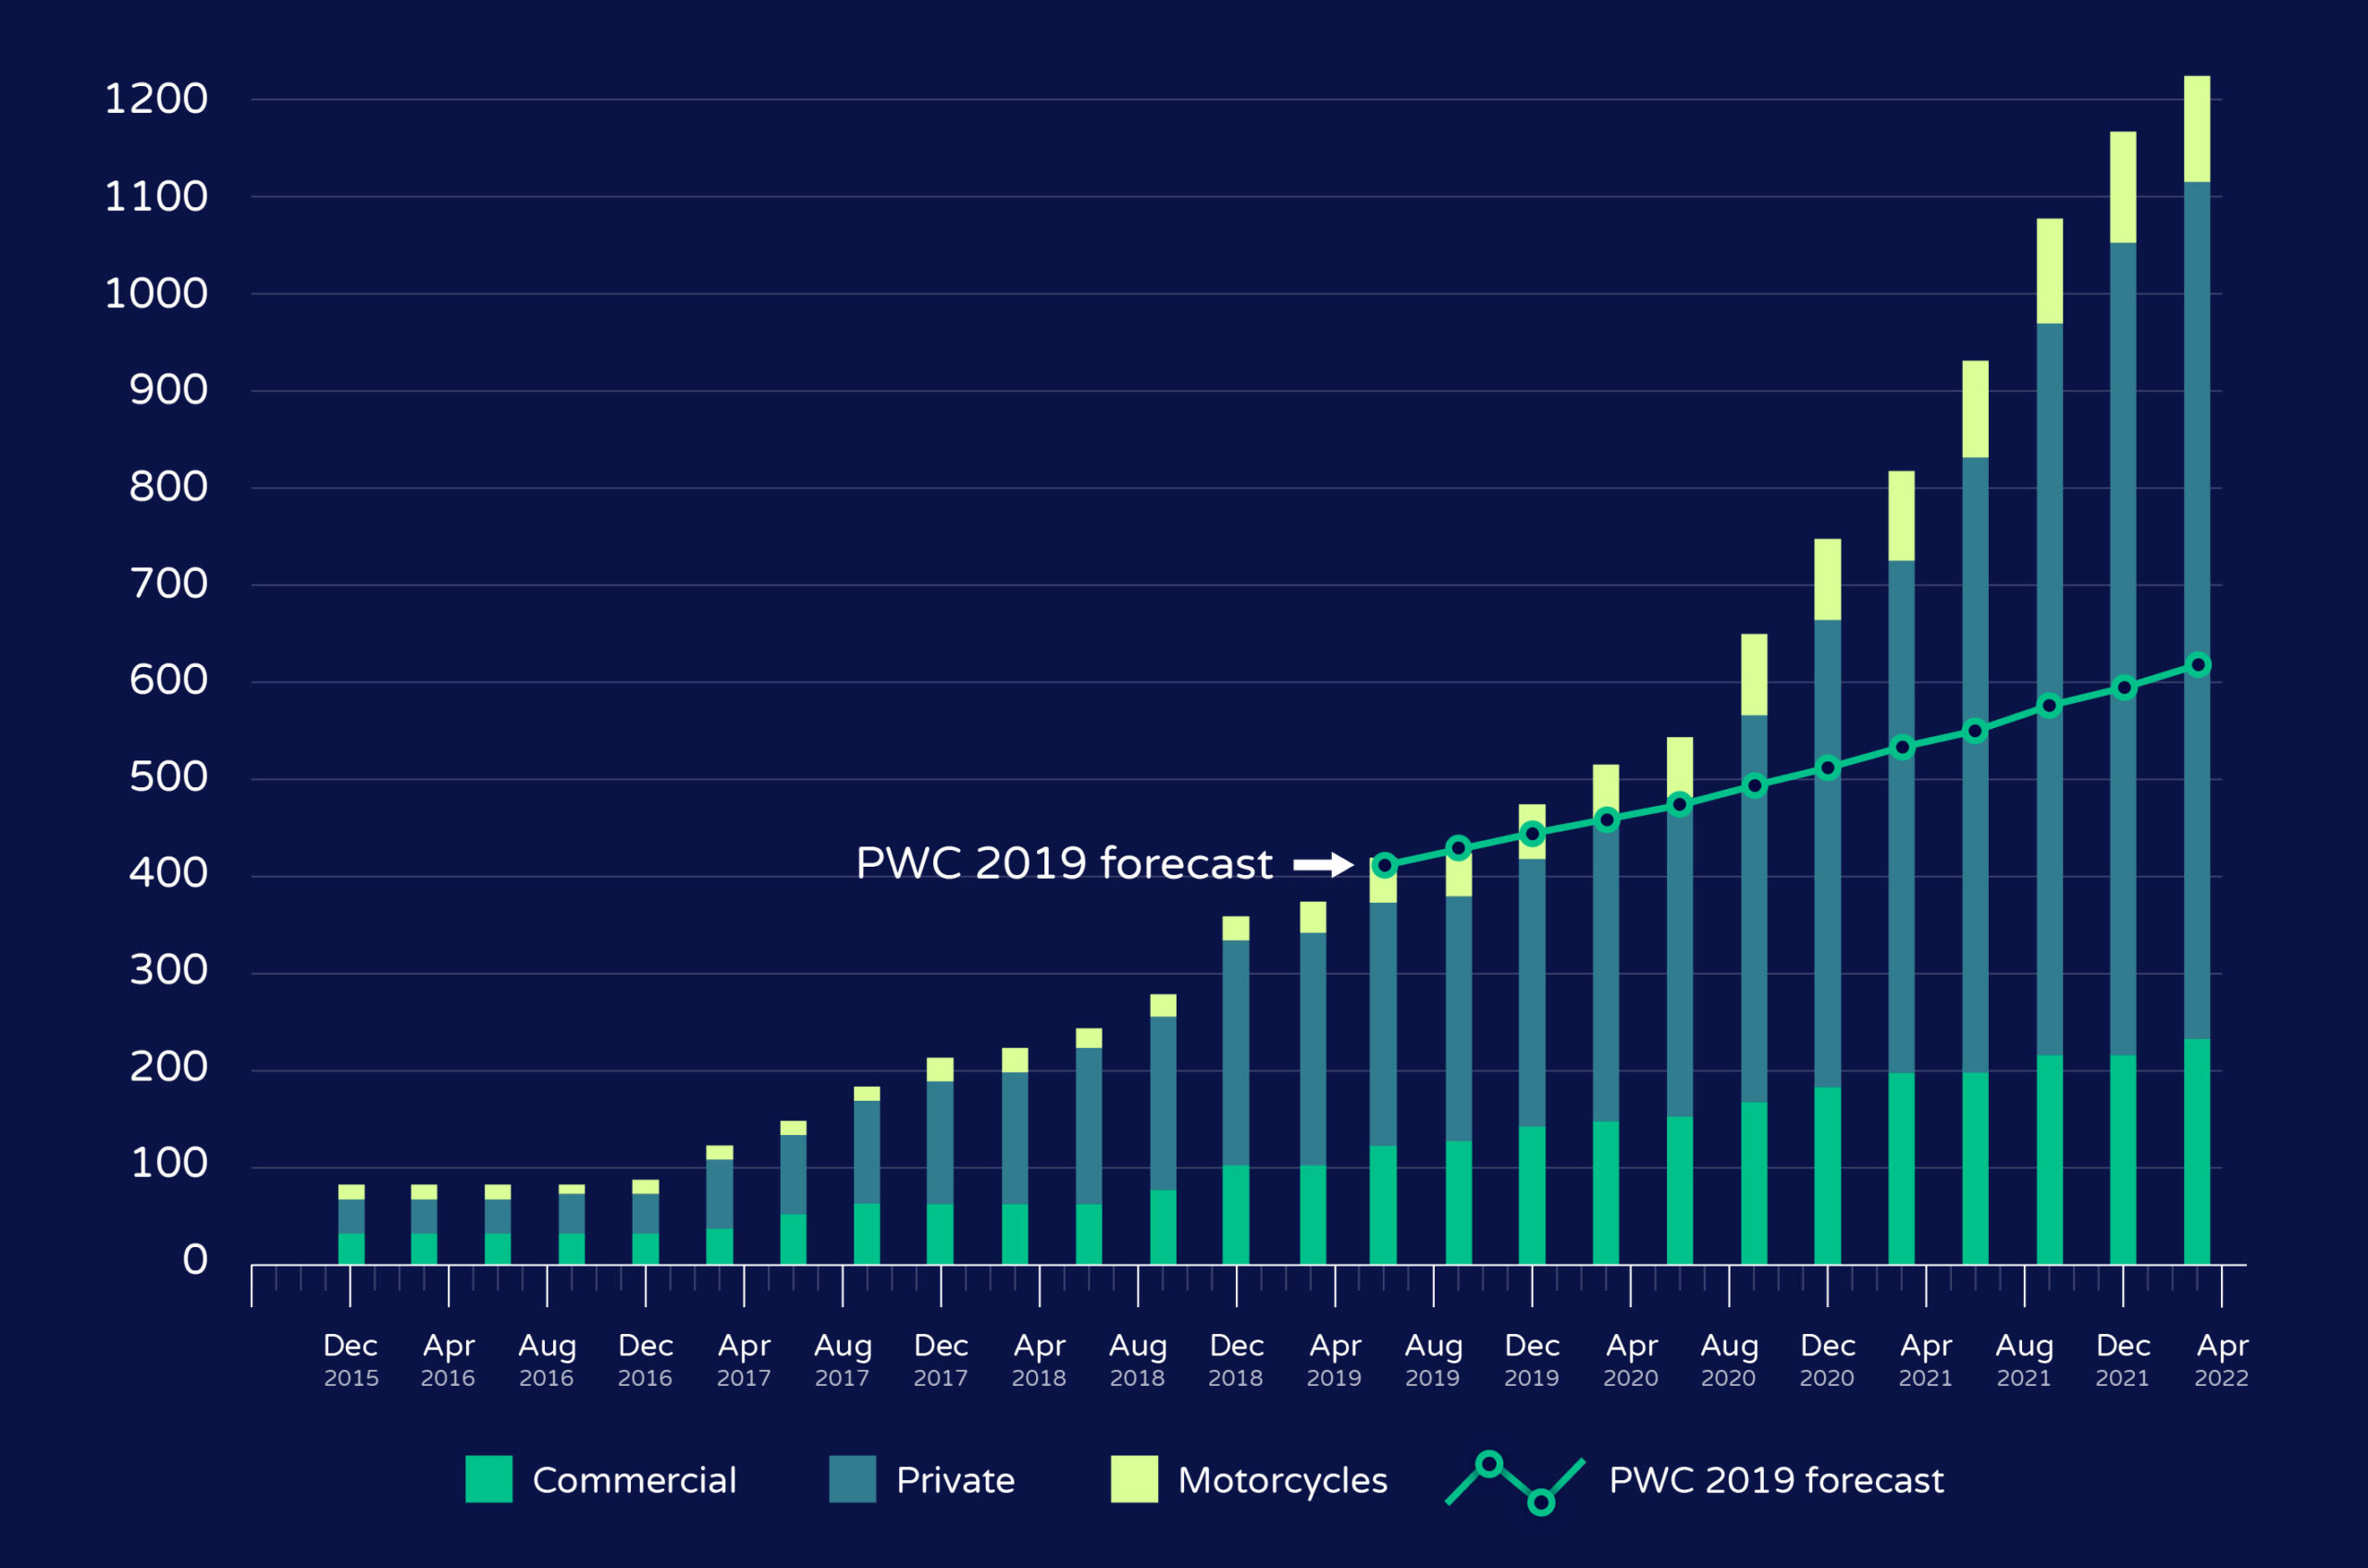
Electric vehicle uptake
The below statistics display the PriceWaterhouse Coopers (PWC) prediction for the number of electric vehicles in use in Guernsey versus the actual recorded number of electric vans and cars now driven.
622
PWC prediction Mar 22
1126
Actual EVs in Guernsey
Source: Driver & Vehicle licensing at the States of Guernsey Traffic and Highway Services
Registered electric vehicles in Guernsey
The States of Guernsey and Guernsey Electricity Ltd commissioned a report undertaken by PriceWaterhouse Coopers (PwC) on future energy demand up until 2050 in connection with the Guernsey Energy Policy. A section of this report focused on the adoption of electric transport to help demonstrate an increase in the island’s electricity demand.
Electric vehicles in Guernsey now represent over 2% of the active vehicles on our roads today and far exceeding PWC’s original predictions made for the adoption of more sustainable transport.
What about alternative fuels?
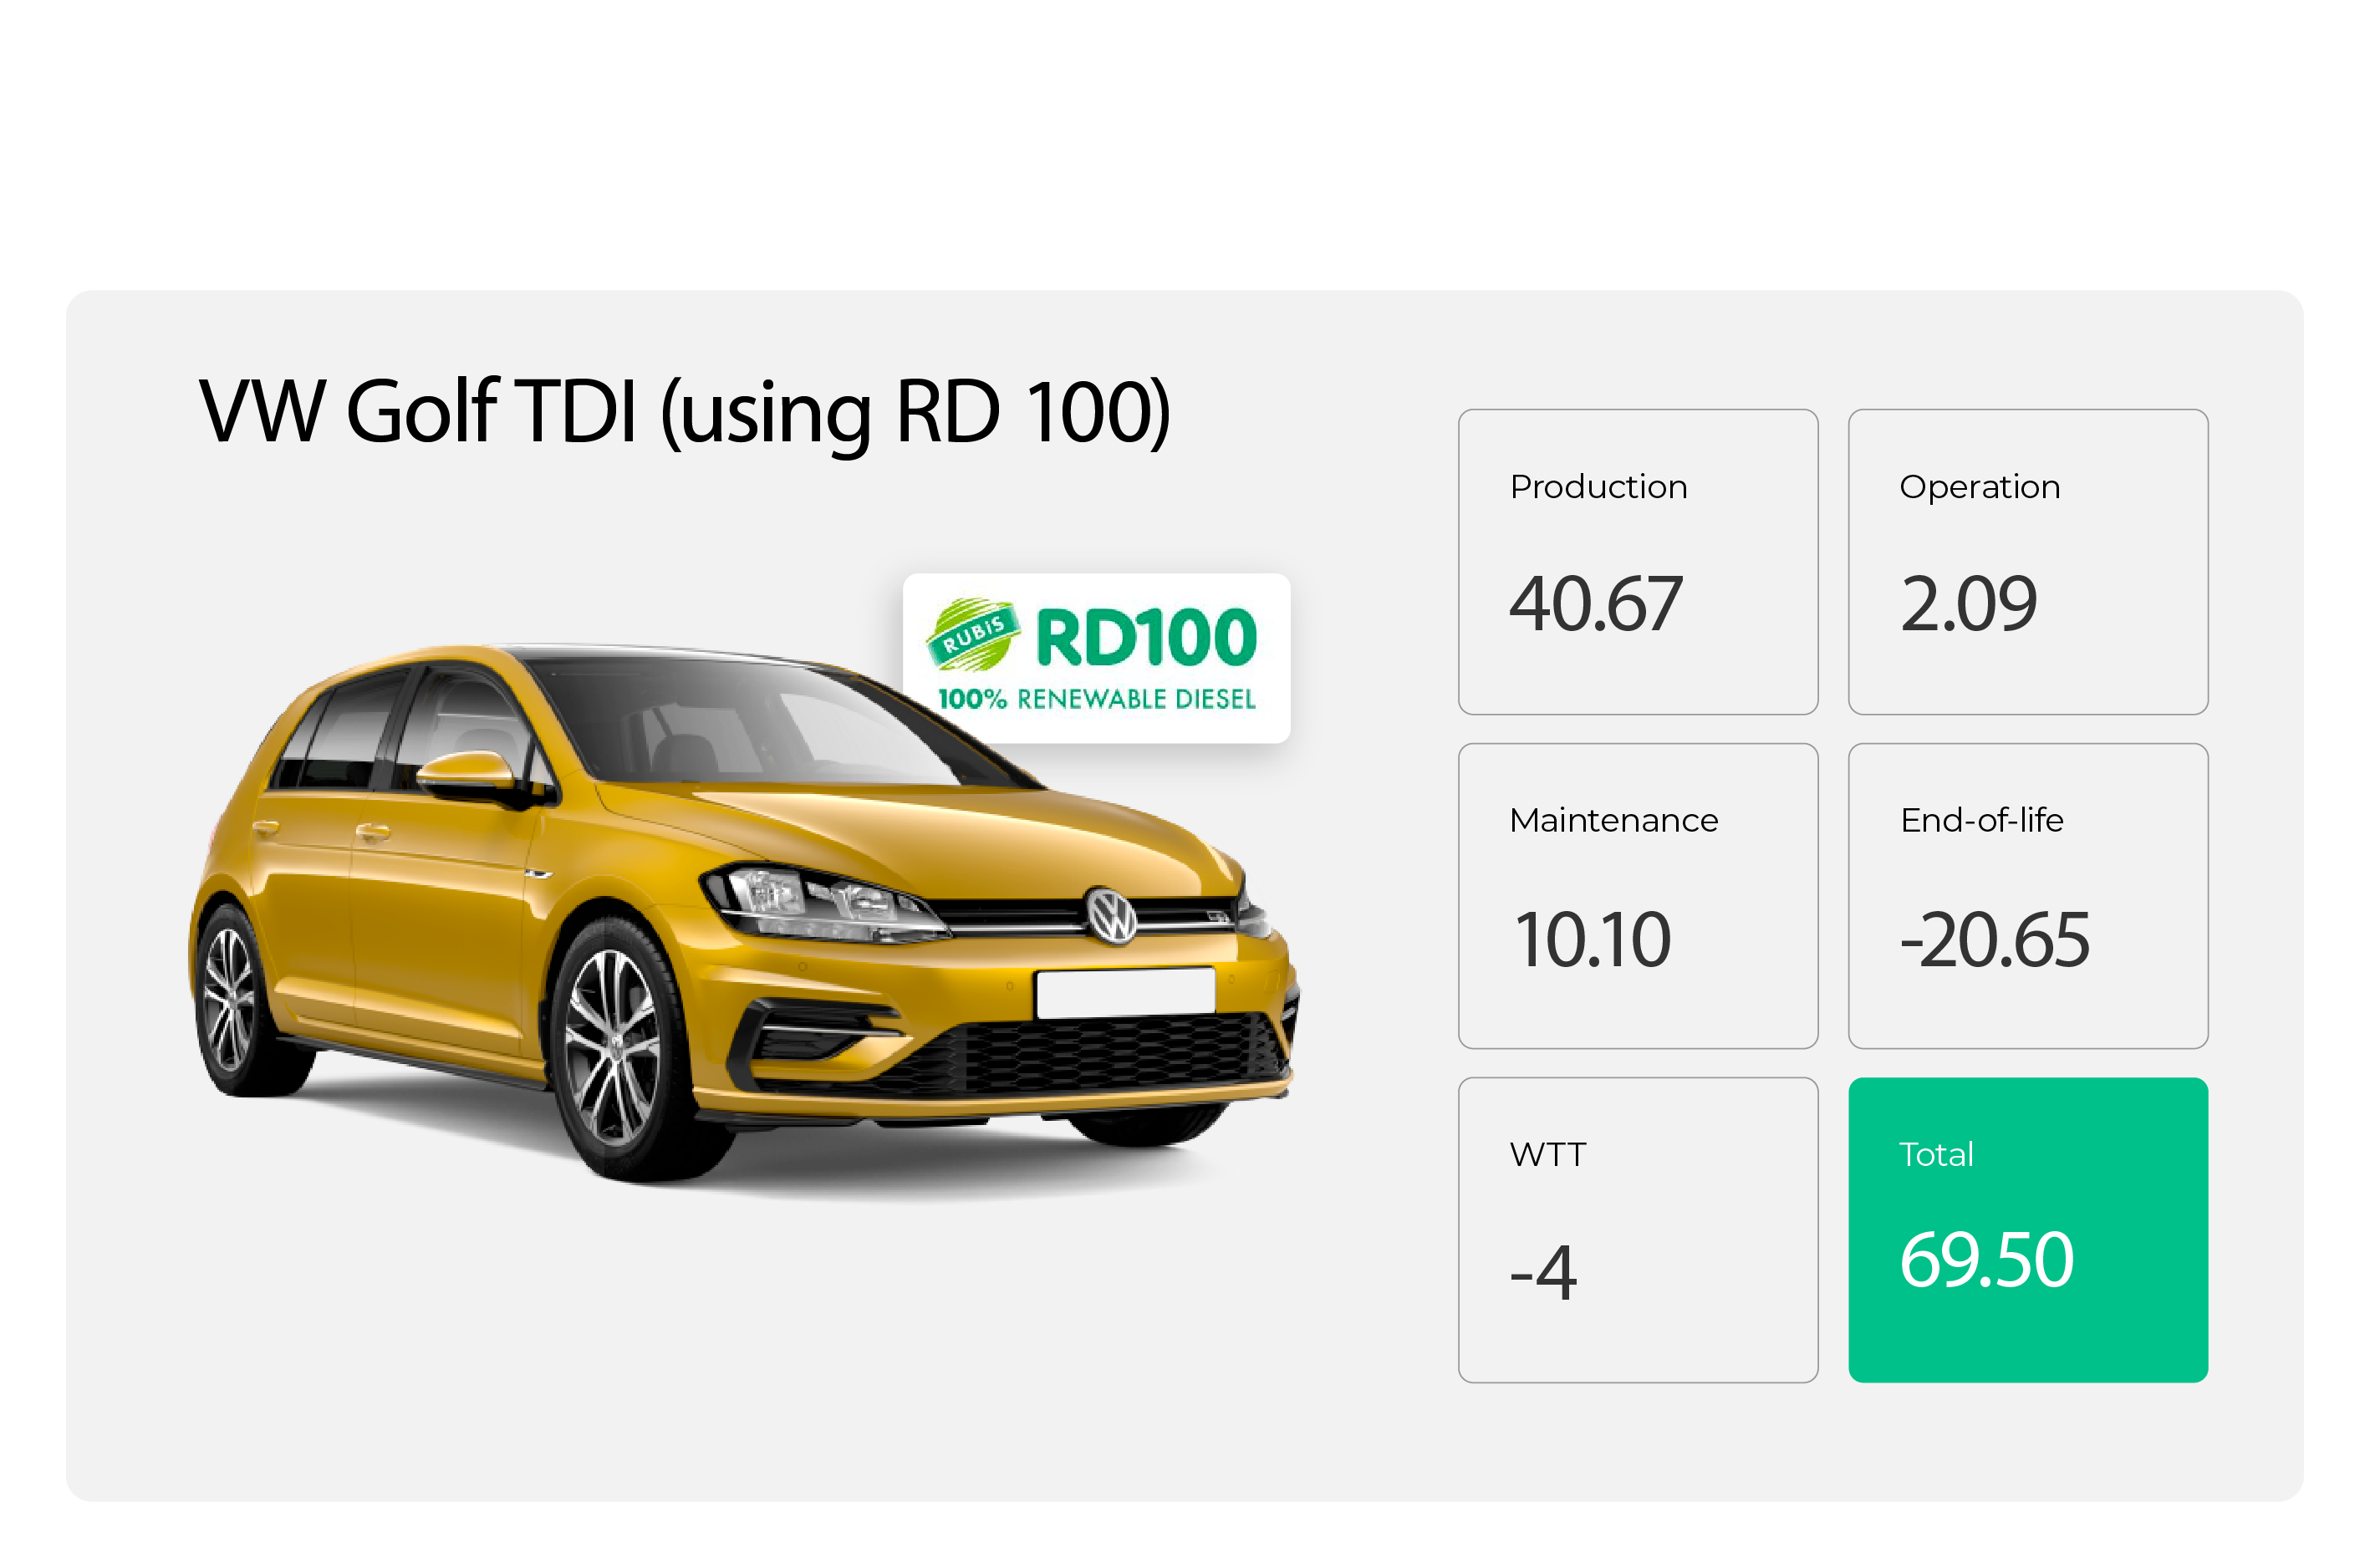
If you’re looking to drive more sustainably but aren’t ready to buy an electric vehicle yet, renewable fuel could be the answer.
There has been much talk recently about a viable replacement for petrol and diesel. Alternatives such as Biofuel and Renewable Diesel are some of the main options as they have a lower carbon intensity over their lifetime – but it’s worth remembering that these vehicles will still produce tailpipe emissions.
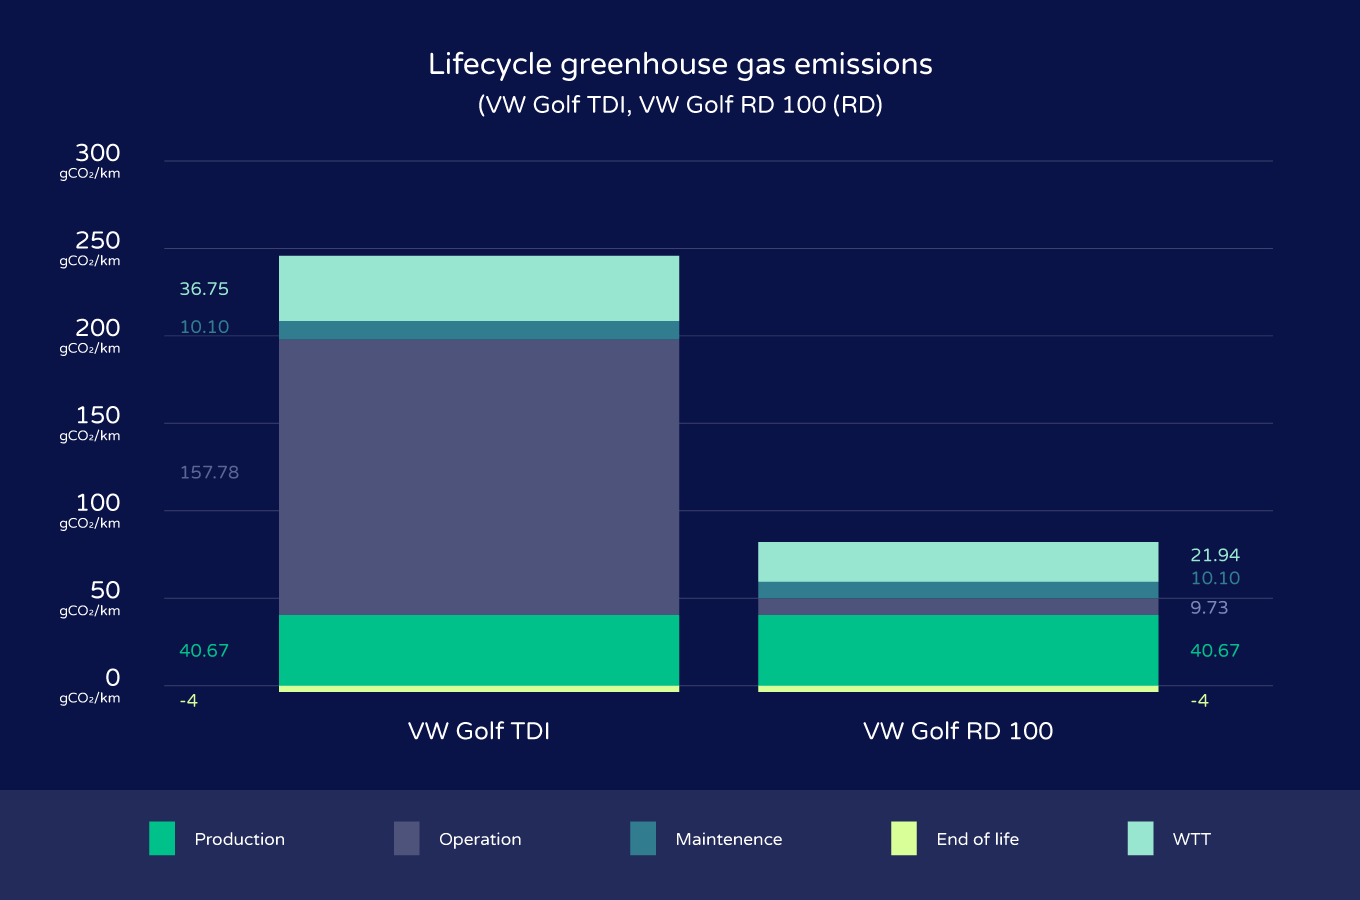
Renewable Diesel – RD100 – is available for purchase at some forecourts in Guernsey and could be an excellent transition fuel due to the lower carbon emissions when compared to petrol or diesel.
If you drive a diesel vehicle, switching to RD100 at the pumps means you could be producing around 70% less carbon emissions and significantly reduce your carbon footprint.
The following figures display the lifecycle greenhouse gas emissions in grams of CO2 per kilometre driven